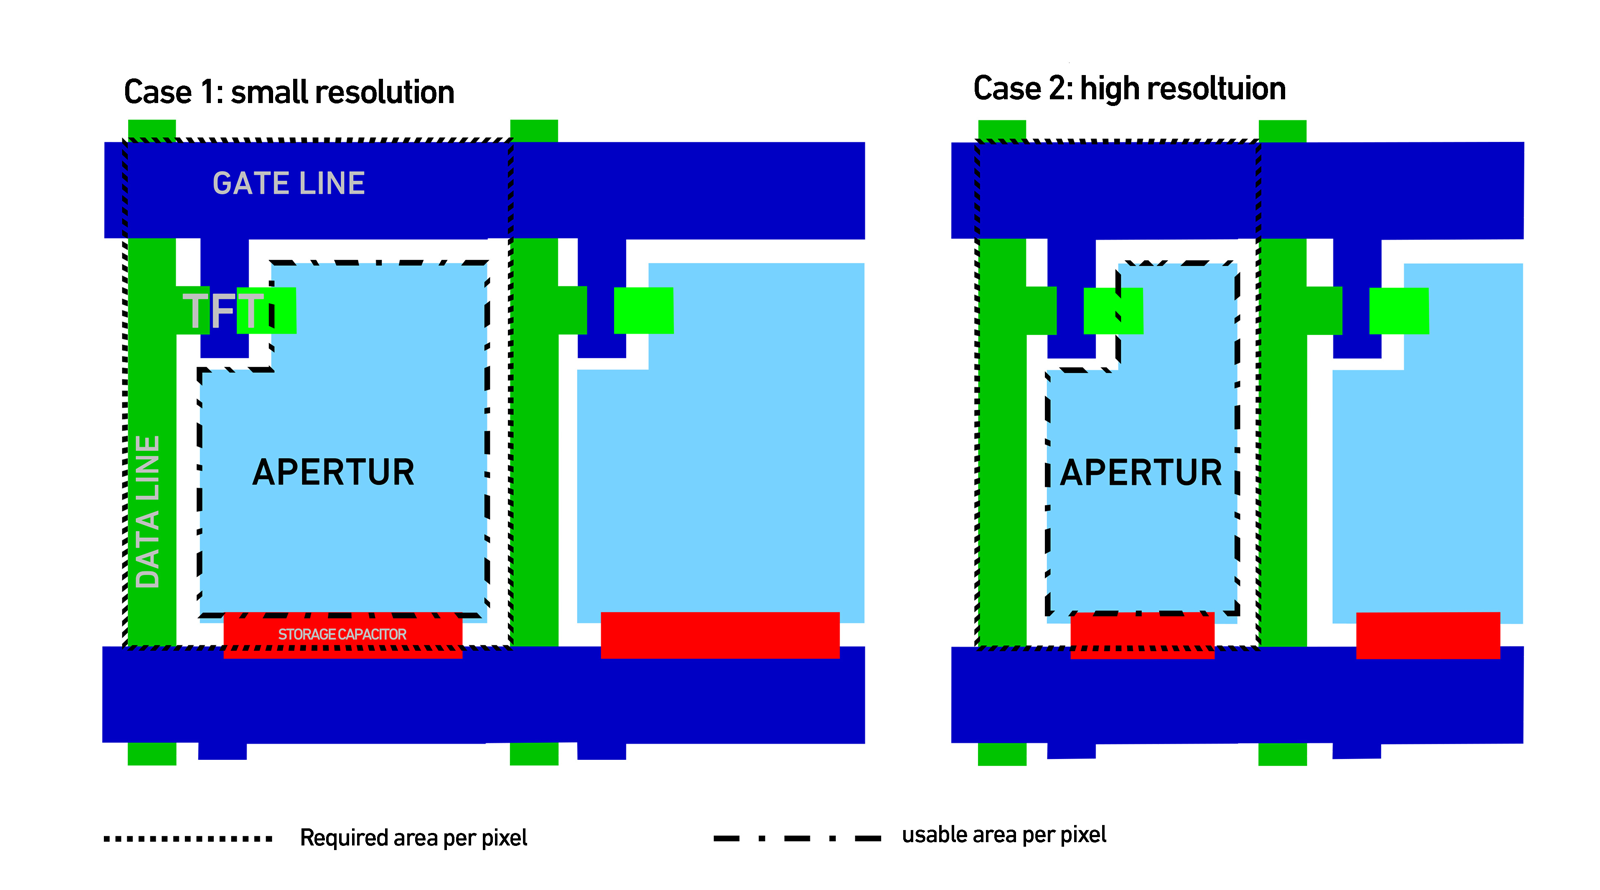
Figure 1: The graphic shows schematically the ratios of the necessary area –
compared to the usable
area
If you look at the structure of a TFT display under the microscope, it becomes clear why this is so. A high
pixel density. A high pixel density (Figure 1, case_1 and case_2) reduces the usable area per pixel. Since in a
TFT display the individual pixels have to be switched by integrated transistors, the entire surface of the glass
cannot be used. The aperture ratio becomes worse and worse with increasing resolution. In addition, the
transistors and the necessary supply lines occupy a large, usually constant part of the available surface. As a
result, even under ideal conditions (all pixels active), the transmission of the display glass is only about 10
percent for low resolutions and about 8 percent for high resolutions. This means that of a backlight with a
brightness of originally 1000 cd/m2, only 100 cd/m2
can still be measured on the surface of the display.
Local Dimming
To counteract this problem, ever brighter backlights are being used. New LED technologies and the associated
improved efficiencies make this possible. But this approach also has a disadvantage. Physically, a switched-off
pixel can never block 100 percent of the light coming from the backlight. This is very visible on an LCD TV in a
dark room. The black areas appear grey-blue. The difference in brightness between a pixel area that is switched
off and one that is switched on is the maximum contrast ratio of the LCD panel.
If this ratio is particularly
high, the result is an intense picture with strong colours. But how can the contrast ratio be further increased
with the ever-increasing pixel density? The solution is local dimming.
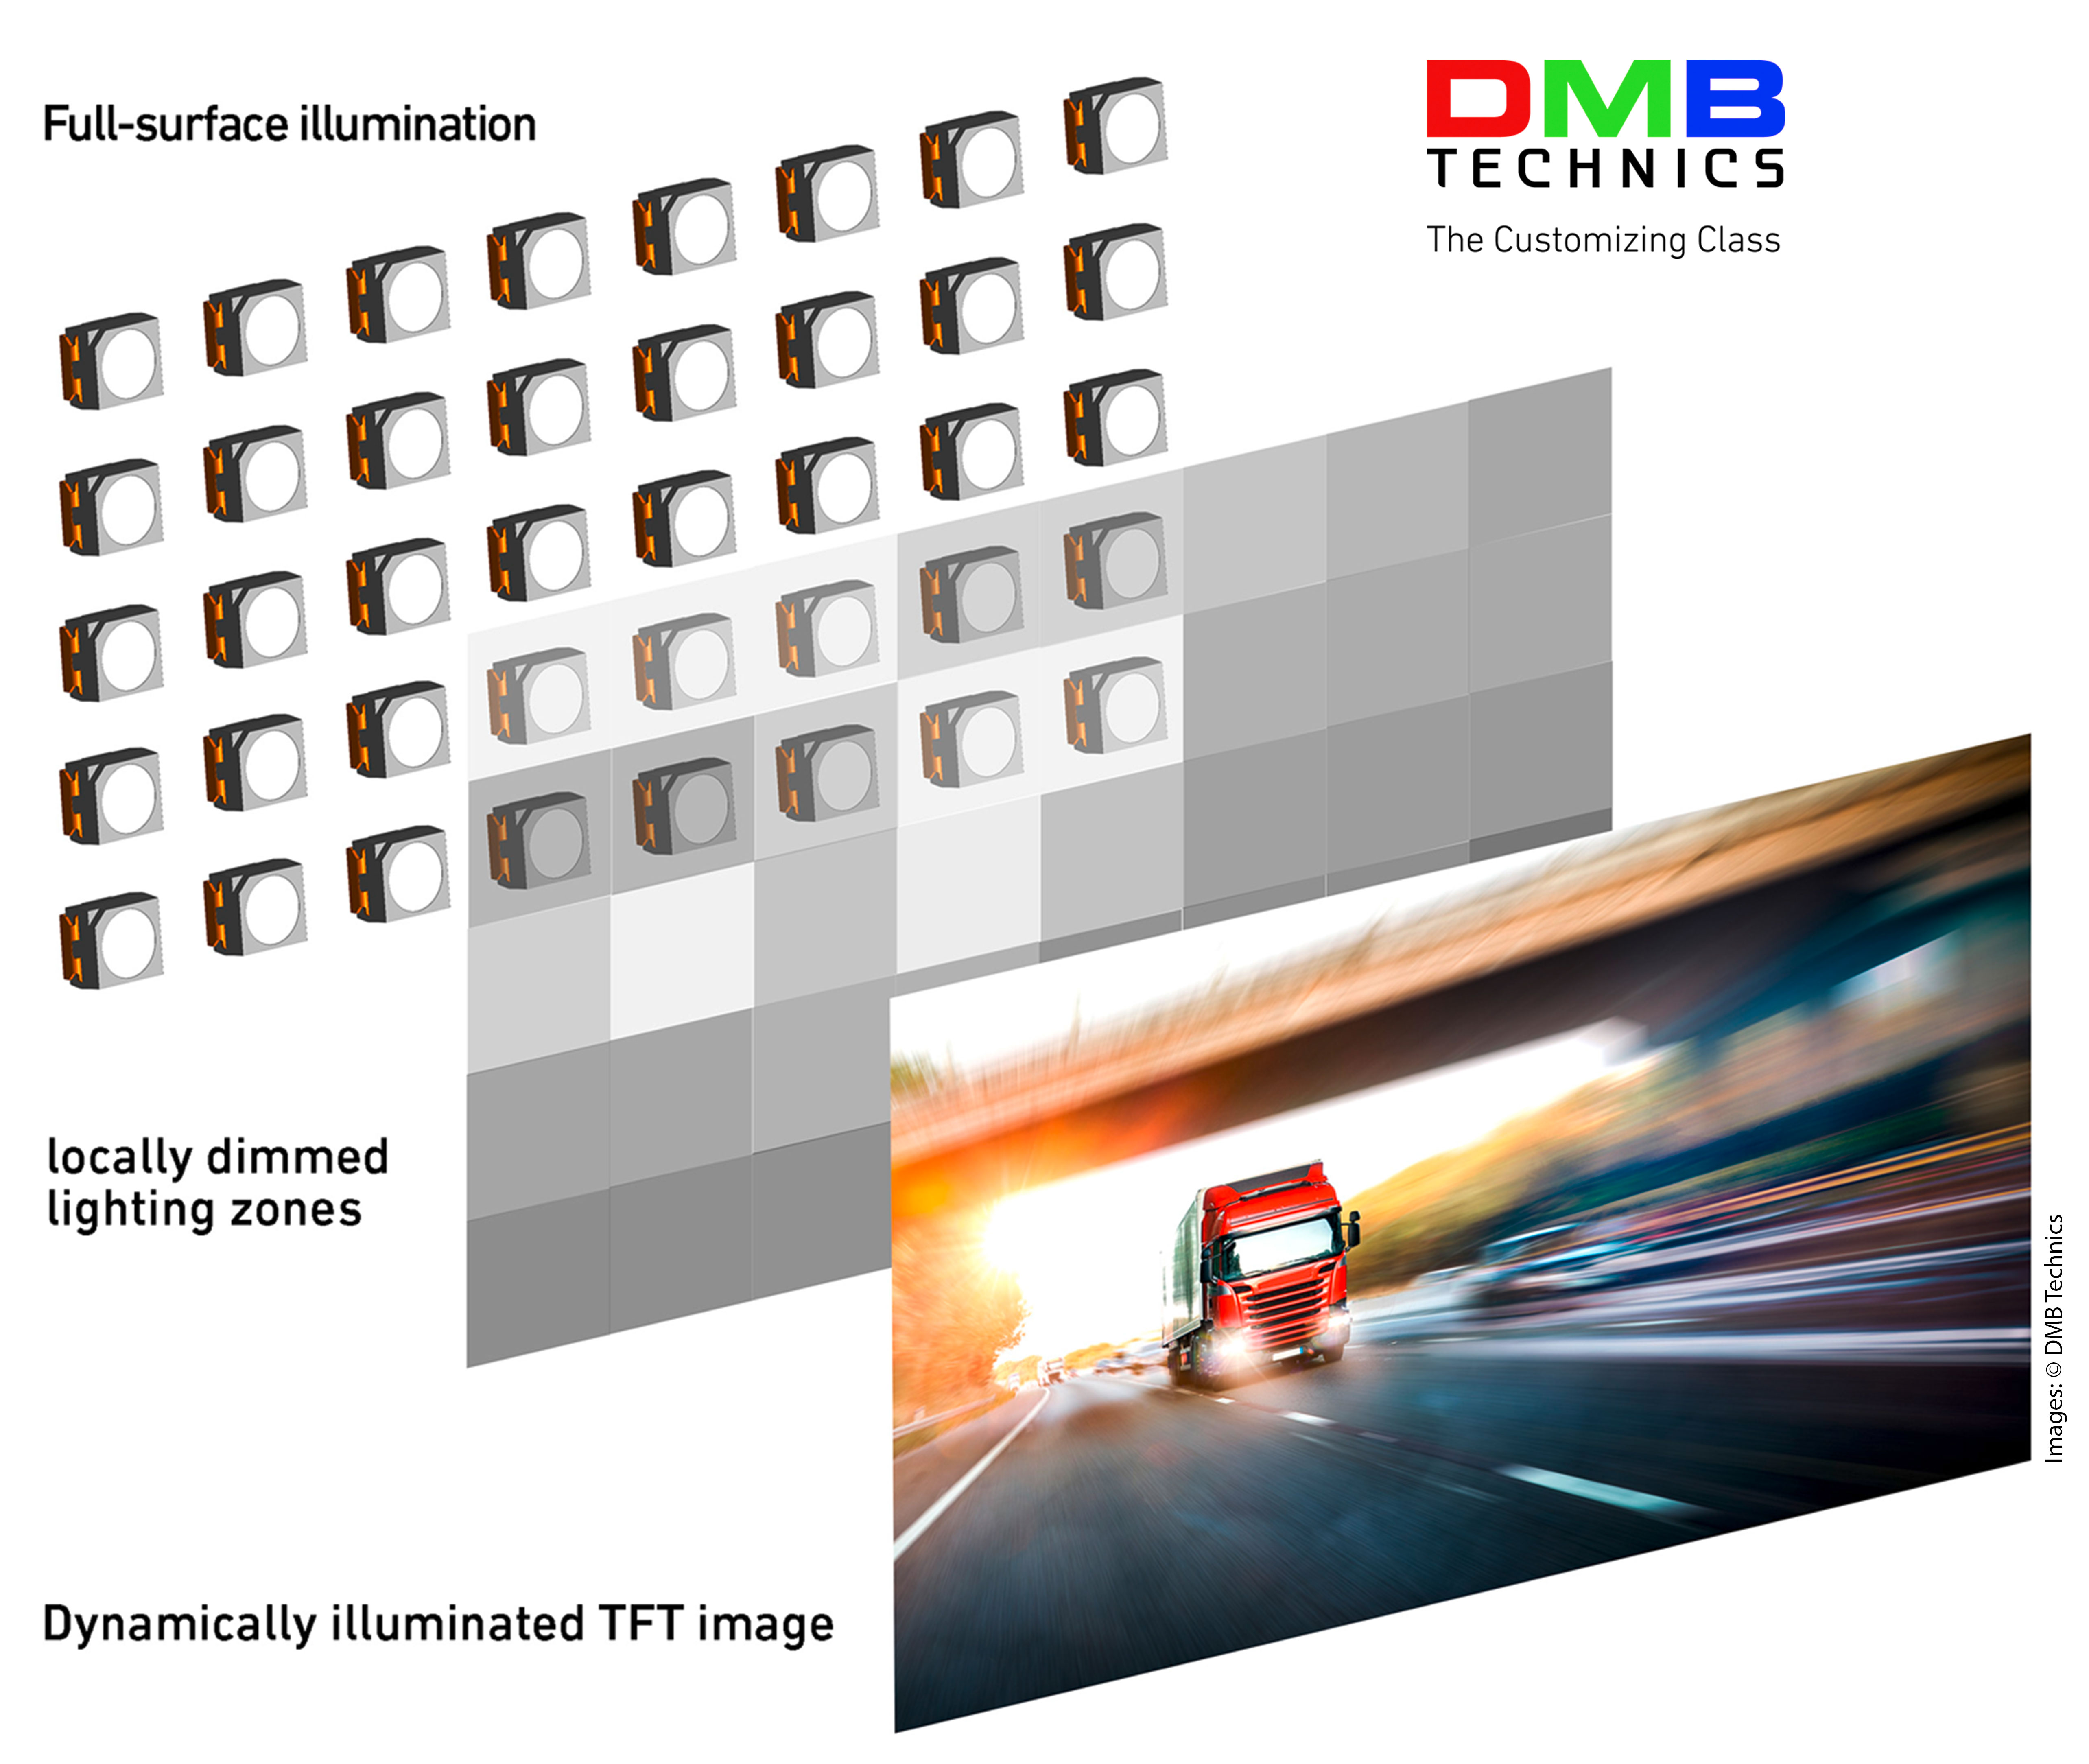
With local dimming, the light for the backlighting is not coupled in from the side and spread homogeneously over
the entire surface, as is usually the case. Instead, full-surface illumination is provided by means of
individual LEDs. This type is often referred to as direct type and is the most common illumination (Figure 2).


